
Last updated: November 2026
THE SHORT ANSWER
This B2B SEO case study shows how I helped a US custom sports apparel manufacturer go from an average of 44 leads a month (64 in July) to 172 leads a month in 2.5 months (August 1 to October 19, 2026). The site already had plenty of blog traffic, but that traffic did not bring orders. I moved the focus to buyer pages: new titles and meta descriptions, internal links from blogs to product pages, commercial content instead of more general blogs, and cleaner tracking. Clicks to buyer pages grew 56%, and visits from ChatGPT grew 313%.
Project Snapshot
Business
US custom sports apparel manufacturer (fully custom team uniforms with names and numbers)
Buyers
Teams, schools, clubs and leagues ordering in bulk (B2B)
My role
In-house SEO Project Team Lead, leading a small SEO and outreach team
Timeline
Aug 1 to Oct 19, 2026 (about 2.5 months)
Data sources
Google Search Console, GA4 and the website’s lead list
Main result
44 → 172 leads a month
I am not naming the company. All screenshots have the domain and page names hidden.
The Starting Point: Lots of Traffic, Few Leads
When I took over the company’s SEO on August 1 as its in-house SEO Project Team Lead, the site already had strong traffic, but very little of it turned into quote requests. Earlier blog posts, such as team name lists and sports rules guides, brought most of the clicks. Those readers were fans and players, not coaches ordering uniforms.
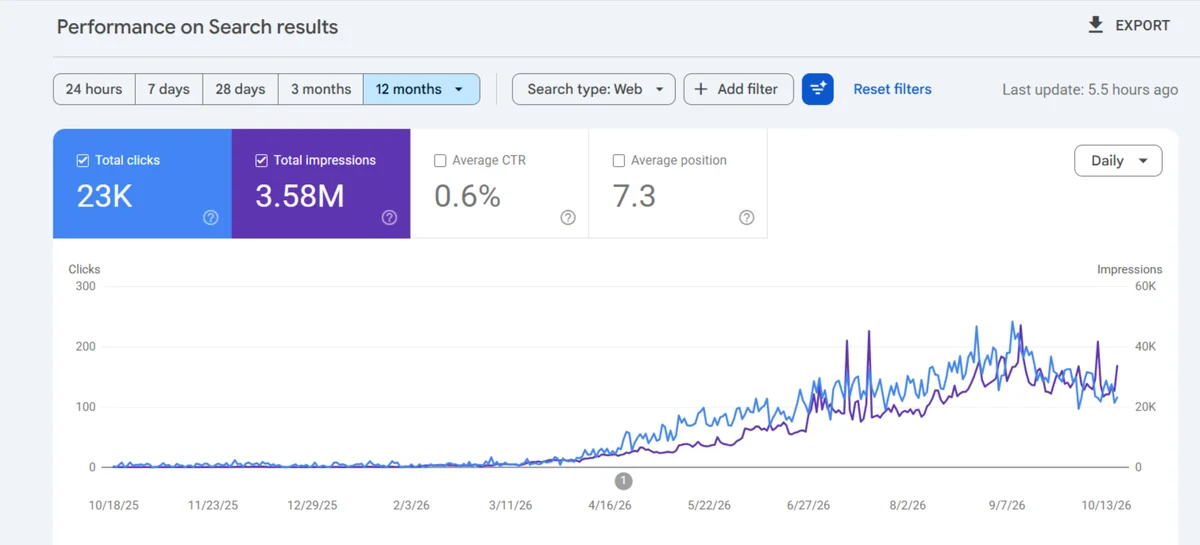
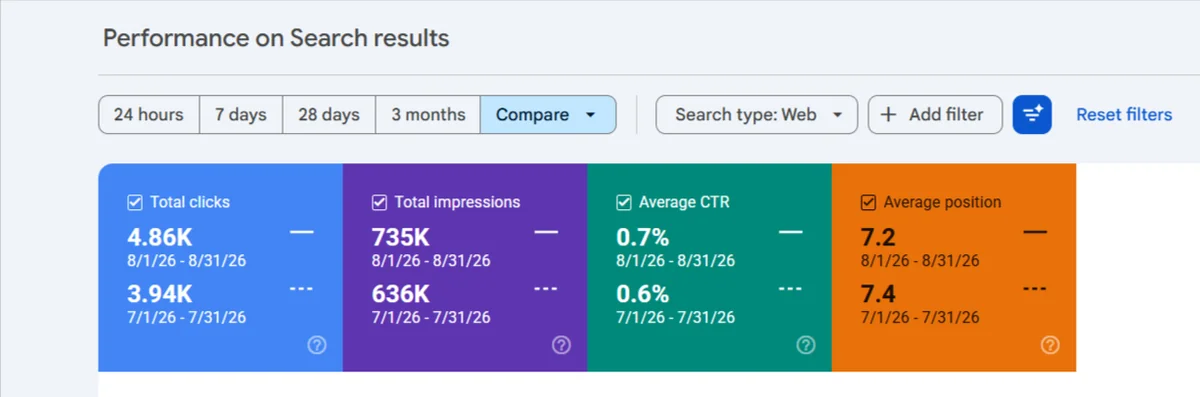
In July, the site got about 3,940 clicks from Google. About 3,370 of them, or 85%, went to blog posts. Only 570 clicks reached the pages that actually sell: the sport pages, product pages, home page and contact page. The site averaged just 44 real leads a month from May to July.
A quick audit found the reasons:
- Blogs did not point buyers anywhere. Popular posts had few links to the sport and product pages.
- Titles and descriptions were weak. Buyer pages showed up in Google, but few people clicked them.
- Trust details did not match. One section showed “219+ reviews” and another “235”, one review appeared twice in the page code, and delivery times were written in different ways on different pages.
- The numbers were not reliable. Bot traffic was mixed into Google Analytics, so engagement looked like 14%. There was no clear report of leads by sport or by month.
- The link profile needed cleaning. About half of the live anchor texts pointing to the site came from spam links.
What I Changed in 2.5 Months
The plan was simple: stop chasing more traffic and turn the existing traffic into buyers.
1. Rewrote titles and meta descriptions on buyer pages
I rewrote the titles and descriptions on the home page and every sport page so they matched what coaches search for, such as custom uniforms, pricing, and team orders. The goal was more clicks from the rankings the site already had. You can see the method in my guide to writing SEO meta data.
2. Linked the popular blogs to buyer pages
The blogs had the traffic, and the sport pages needed it. I added internal links from relevant blog posts to the matching sport and product pages, so readers and Google could find the pages that sell.
3. Switched from general blogs to commercial content
We stopped writing general sports blogs because those clicks never brought leads. New topics targeted buyers instead: pricing guides, buying guides, company comparisons and “how to order team uniforms” guides, each linking to a sport page.
4. Fixed trust and on-page details
We standardized delivery wording and other key details across the site, so buyers and Google saw one clear message everywhere.
5. Built relevant backlinks and checked bad ones
My team and I ran outreach for relevant, niche sports and apparel links. I also checked the anchor text profile and prepared a disavow list for the spam links. More on this approach in my off-page SEO guide.
6. Cleaned the data and tracked leads by sport
I removed bot and spam traffic from Google Analytics reporting, which moved the engagement rate from 14% to 57%. I also built a lead report by sport and by month, with test leads and duplicate emails removed. That report did not exist before, and every lead number in this case study comes from it.
The Results
Real leads grew from an average of 44 a month (May to July) to 172 a month (August and September). Each table below shows its own dates.
44 → 172
real leads a month
+56%
clicks to buyer pages (July → September)
+313%
visits from ChatGPT (GA4)
7% → 11.1%
home page click rate
Leads month by month
| Month | Real leads | Note |
|---|---|---|
| May | 23 | Before my work |
| June | 46 | Before my work |
| July | 64 | Before my work |
| August | 168 | My work started August 1 |
| September | 176 | Best month |
| October 1 to 15 | 82 | On pace for about 170 |
Leads were already rising before August (23 in May, 46 in June, 64 in July), so not all of the jump is mine. But July to August went from 64 to 168, a much bigger step than the earlier trend, and it held in September.
Google traffic to buyer pages
July
Whole site: 3,940 clicks
Blog: 3,370
Buyer pages: 570
Buyer share: 14.5%
August
Whole site: 4,860 clicks
Blog: 4,120
Buyer pages: 740
Buyer share: 15.2%
September
Whole site: 5,190 clicks
Blog: 4,300
Buyer pages: 890
Buyer share: 17.1%
Buyer page impressions almost doubled, from 24K in July to 47K in September. The buyer share of clicks rose every month, reaching 18% in early October.
Better click rates from the meta rewrites
Click rate (CTR) is the cleanest test of title and description work, because it shows whether people click when Google shows the page. CTR went up on 7 of the 8 pages I checked, comparing July 17 to October 14 (the same 3-month report as the GA4 table below) with the 3 months before:
| Page | CTR before | CTR after |
|---|---|---|
| Home page | 7.0% | 11.1% |
| Contact page | 1.8% | 3.2% |
| Ice hockey page | 0.9% | 2.0% |
| Wrestling page | 0.5% | 1.1% |
| Esports page | 0.4% | 1.1% |
| Rugby page | 0.2% | 0.8% |
| Soccer page | 1.1% | 1.8% |
The basketball page went from 2.3% to 1.5%, because it started showing for many more page 3 keywords.
Buyer keywords that moved
Average Google position, September 16 to October 13 compared with the 28 days before (lower is better):
- “basketball uniform”: position 11.4 → 3.3 (page 1)
- “custom hockey jacket”: position 30.7 → 7.7 (page 1)
- “custom reversible basketball jerseys”: 26.0 → 13.7
- “custom lacrosse jerseys”: 57.3 → 20.2
Two Google spam updates, no penalty
Google ran spam updates on August 18 to 21 and September 24 to October 8, 2026. The site was not hurt by either one. Daily clicks rose from about 160 to 230 during the first update and stayed flat during the second.
The AI Search Side: ChatGPT Leads
ChatGPT became a major lead source for this business. In the company’s lead records, ChatGPT was already the largest single source of leads, ahead of Google. From mid-July to mid-October, ChatGPT visits grew much faster than Google visits:
| Source (GA4) | 3 months before | Jul 17 to Oct 14 | Change |
|---|---|---|---|
| 2,011 | 4,125 | +105% | |
| ChatGPT | 927 | 3,830 | +313% |
| Bing | 122 | 221 | +81% |
This GA4 window starts two weeks before my work started, because it was a standard 3-month report, so most of it covers my work. GA4 also counts fewer visits than Search Console clicks, because of bot filtering and cookie consent.
Why ChatGPT sent buyers: AI tools pick pages with clear, direct facts. This site’s sport pages already had long content, FAQ sections and full schema. Our work made the buyer pages easier to find and gave them clearer, consistent details like delivery times. This is generative engine optimization (GEO) in practice: being the page an AI tool trusts enough to recommend.
Then ChatGPT visits dropped by half on October 9. I checked page by page, and every page and every sport dropped on the same day. It was not a site problem. Industry trackers saw the same thing across most websites after a ChatGPT update: LLM Pulse measured a 46% drop, and Search Engine Journal reported that it was mostly a tracking problem: many ChatGPT links stopped passing their source tag, so the visits showed up as “Direct” in analytics. OpenAI fixed the bug around October 15, and tagged ChatGPT visits started showing again. Because our GA4 window includes October 9 to 14, the +313% is probably a little lower than the real number.
The lesson for any business: track AI visits weekly, but judge AI search by leads, not by one analytics label. For a deeper look at what happens when a site leans too hard on AI, read my manual vs AI SEO case study.
Was It Just the Season?
Partly, for football. Not for baseball or basketball. August and September are the football and back-to-school season, so football leads would rise anyway. But Google Trends showed searches for baseball and basketball uniforms running about 40% below normal in September, and our leads for those sports still held steady at 28 to 34 a month. The site was winning a bigger share of a smaller market.
What Did Not Work Yet
Every case study should show the gaps too. Here is what was still open when my work ended:
- The biggest money keywords were still on pages 4 to 6. “Custom baseball uniforms”, “custom basketball uniforms” and “custom softball uniforms” did not move. Metas and internal links raise clicks, but these pages need a full content refresh, real photos, and stronger backlinks to reach page 1.
- Product pages were not touched. They still had old titles, thin text, and AI images.
- Soccer leads halved while soccer searches grew 20%. The soccer page needs work.
- Lacrosse and ice hockey impressions fell by 40% to 53%.
- Trust gaps against competitors: no real product photos, no design galleries, no free sample offer. These need the design and sales teams, not only SEO.
What I Learned
- Traffic is not the goal for B2B. Leads are. 85% of the clicks went to blogs that never sold anything.
- The fastest win is often the rankings you already have. Better titles and internal links raised leads before the big keywords moved.
- Track leads by source and by month from day one. Without clean data, you cannot prove what worked.
- AI search is real, but its tracking is not stable. One ChatGPT update changed how half the visits were labeled overnight.
Frequently Asked Questions
What is B2B SEO?
B2B SEO is search optimization for businesses that sell to other businesses or organizations, like teams, schools and companies. The goal is quote requests and orders, not just traffic, so the focus is on buyer pages, trust details and lead tracking.
How long does B2B SEO take to bring more leads?
It depends on where the site starts. In this case study, leads went from 64 in July to 168 in August, the first month, because the site already had traffic and we redirected it to buyer pages. Moving big competitive keywords to page 1 usually takes longer, often 4 to 12 weeks after a page is improved, plus backlinks.
Can ChatGPT really send B2B leads?
Yes. For this manufacturer, ChatGPT was the largest single source of leads in its records. AI tools tend to recommend pages with clear facts, such as prices, sizes, delivery times, and FAQs.
Why did ChatGPT traffic drop in October 2026?
After a ChatGPT update on October 9, 2026, many sites saw ChatGPT visits fall by about half on the same day. It was mainly a tracking bug: many links stopped passing their source, so visits appeared as “Direct” in analytics. OpenAI fixed it around October 15, and tagged ChatGPT visits started showing again.
Why did leads grow if the main keywords stayed on page 4?
Because most leads came from pages that already ranked. Better titles raised click rates, internal links sent blog readers to buyer pages, and AI search added more visits. The main keywords are the next step and need content and backlinks.
Final Thoughts
This project shows what B2B SEO should focus on: turning the traffic you already have into buyers, then building toward the big keywords. In 2.5 months, leads went from an average of 44 to 172 a month without a single new general blog post.
If your website gets traffic but not enough quote requests, contact me. You can also read more results on my SEO case studies page, including my ecommerce SEO case study.

SEO consultant with 11+ years of experience helping e-commerce, legal, medical, and local service businesses in 30+ countries, mostly the US, UK, Canada, and Australia, get found on Google, Bing, and AI search engines like ChatGPT, Perplexity, and Claude. Every case study on this site uses real data from the project’s Google Search Console, Analytics, or Semrush. Learn more about me, read my SEO case studies, or work with me.

